Finding and using data on the SEED map
Using the SEED Map - Quick start guide
Using the SEED Map – Quick start guide
Many of the datasets in SEED can be viewed and combined on the SEED map. This allows you to visualise how the data is distributed across NSW, and how it relates to other datasets.
This page describes how to view the map and quick tips for getting started.
Check ‘Overview of SEED map features and functions’ for a detailed explanation of each map feature.
How to display the map
There are two main ways to display the map:
- ‘Data first’ method: Start by finding dataset(s) in SEED, then select one or more to view on the map. SEED will open the map and load your selected dataset(s) onto the map, with the legend details displaying to the left of the map.
- ‘Map first’ method: Select 'SEED Map' on the SEED website menu to display a map without data, and start your search for locations and datasets from there. For more information about finding data on the SEED map, click here.
Getting started – quickly
The SEED map runs on an application called Geocortex which, as with any software, requires you to learn a basic set of skills. We recommend you read the help pages linked above, but if you would like to get straight in and start exploring, here are a few things to keep in mind:
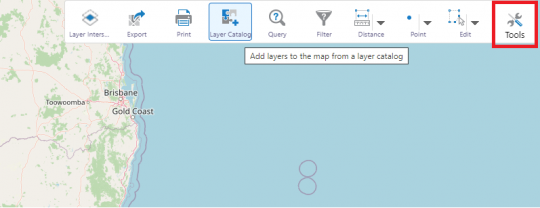
- The 'Tools - Layer Catalog' button is used to add datasets to the map. Datasets in the Layer Catalog are grouped by organisation.
- Some datasets only become visible at certain magnifications. If you can’t see the data, try zooming in or out.
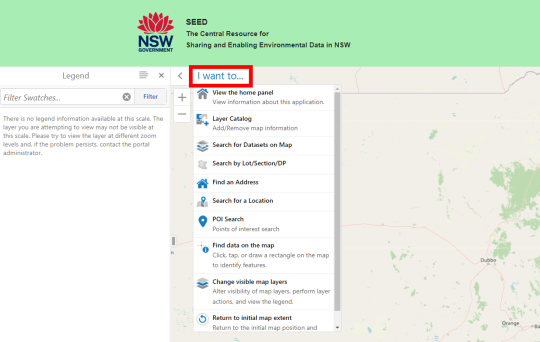
- The ‘I want to…’ button is the starting point to search for locations ('Search for a Location') and retrieve datasets ('Search for Datasets on Map').
- To use ‘Find data on Map’ (under the ‘I want to’ button and right-click menu), you must already have data displayed. You can then use this option to click on a point or draw a rectangle around an area and retrieve more information about the underlying data.
- To switch layers on and off, select the 'I want to...' button, then 'Change visible map layers'. Expand the listing under each organisation and select the required checkboxes.
- The ‘Tools’ button contains a number of tools that enable you to draw and measure shapes, add text and ‘export’ (save) the map as an image or PDF.
- The panel to the left of the map changes to reflect the function you are performing. To switch between the Legend (descriptions of colours and symbols) and Layers (list of datasets), select the ‘Panel Actions Menu’ button (four horizontal lines). Select the 'x' (close) button to return the panel to the previous view.
To find out more information about how to use the SEED map’s features and functions, click here. If you want more information on how to explore the data on the SEED map further, head here.


