Finding and using data on the SEED map
How to Use the Layer Intersect Tool
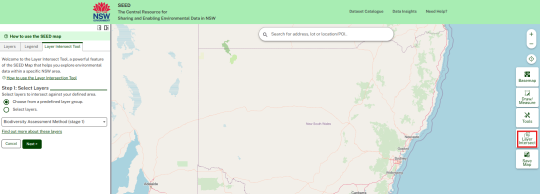
This page will guide you through using the Layer Intersect Tool. You’ll learn how to draw an area of interest, identify and analyse the specific map layers within that area, and download detailed reports.
The Layer Intersect Tool is a powerful feature of the SEED Map that helps you analyse environmental data within a specific NSW area.
The intersect tool calculates the geometric intersection of multiple feature classes and layers to determine if features, or portion of features, are common to all inputs - that is, they intersect. It allows users to see which layers overlap and download reports of the results.
To start, click the Layer Intersect button to open the tool panel.
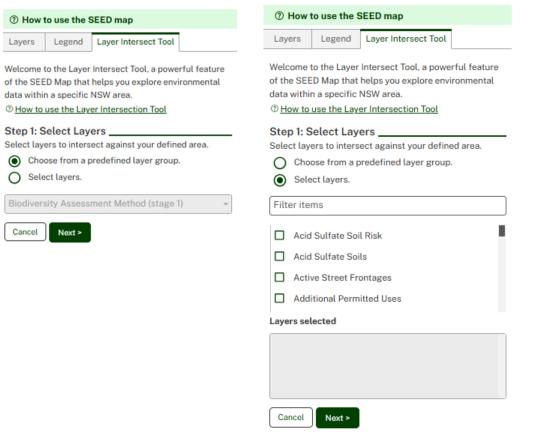
Step 1: Select Layers
Choose from the list of predefined layers. The Biodiversity Assessment Method (BAM) stage 1 layer group is available. More layers and layer groups will be added over time.
OR, Select a custom list of layers.
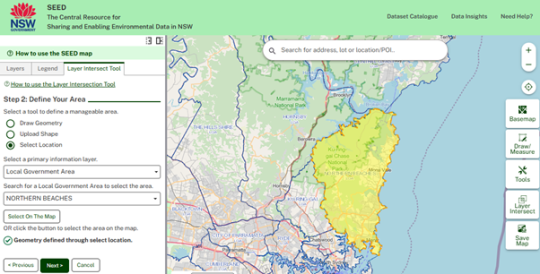
Step 2: Define Your Area
To define your area of interest, Draw Geometry – a rectangle or polygon shape or Upload a Shapefile or Select a Location.
Draw Geometry allows you to draw a rectangle or polygon.
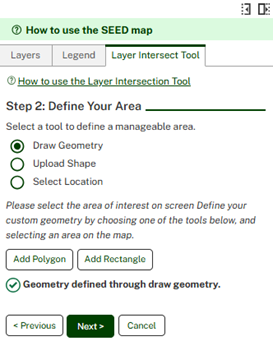
Upload Shape requires the your zip to contain .shp, .dbf and .prj file types.
Select Location options currently are Lot, National Park, Planning District Boundary and Local Government Area. You can use the Search or Click on the map to select the area.
Step 3: Select a Report Type
Simple Report can be generated for large area analysis when it is not feasible to generate a detailed report.
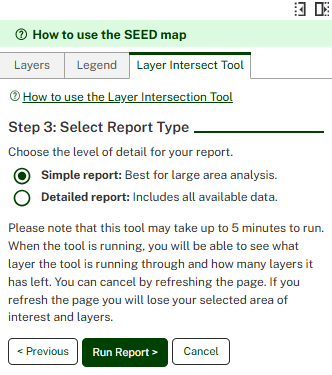
Detailed Report includes a pdf report with a map and summary tables showing the areas where each layer intersects and a csv that shows the area of each feature that overlaps with the layers in the attribute table.
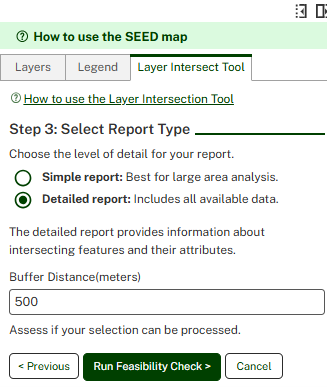
Detailed reports require you to apply a Buffer Distance between 1 and 2000 meters to the area of interest.
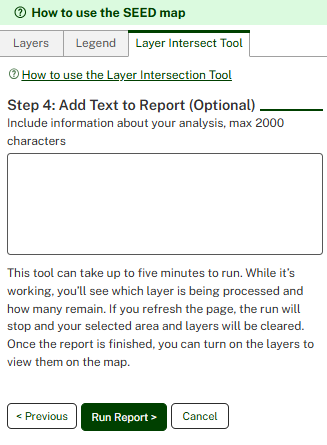
Step 4: Add text to Report (optional)
Include information about your analysis, max 2000 characters. This appears in the PDF Summary Report after the map and before the interest tables.
Click Run Report In the left panel, the intersected layers will appear. Non-intersected layers have been analysed, but don’t fall within the selected area of interest.
You can choose which layers to display on the map, all intersected and non-intersected layers are include in the report.
Click Download report. The tool may take up to 5 minutes to run and when the tool is running, you will be able to see what layer the tool is running through and how many layers it has left. A pop-up will appear when the report is ready to download.