Finding and using data on the SEED map
SEED Map FAQs
Map FAQs and Troubleshooting
This page answers to common questions and problems with the SEED map.
If problems persist or you need assistance, let us know using the SEED Contact Us page.
I’ve selected a dataset – why isn’t it visible on the map?
Some datasets only become visible at specified zoom levels, especially if they contain a lot of data. These will also take a little longer to load. If you can’t see the data (after giving it a few seconds to load), try zooming in or out. Or you can ‘zoom to visible scale’.
The 'Find data on the map' option doesn't seem to be working
To use the 'Find data on the map' option (under the 'I want to...' button) you must first have loaded one or more datasets onto the map. This function then allows you to draw an area on the map to see additional information about the data features within that area. To display datasets on the map, use the 'Search for datasets on map' option, also under the 'I want to...' button, or find them from the main datasets page.
What does the message ‘Problem loading a map service’ mean?
If you receive this message when attempting to view a dataset on the SEED map it indicates that SEED is not able to establish the connection with the server that hosts the dataset. This is normally because the web services are temporarily unavailable (e.g. for maintenance) or because the server is overloaded with requests.
Suggested actions are to refresh your browser, change your selected datasets or basemap, or check back in a little while to see if the service has been restored.
If the problem persists, use the SEED Contact Us page to inform the site administrator, who will contact the responsible organisation. In many cases, the problem can be easily resolved.
Why isn’t the map view available for all datasets in SEED?
Some datasets are not currently spatially enabled. However, wherever possible the SEED team is working with data providers to include visualisation capabilities for datasets.
The map reloads when viewed on my handheld device
The SEED map is optimised for desktop viewing and may have variable performance on some handheld devices (tablets and smartphones). If you encounter problems such as the map reloading, it is recommended that you view it on a desktop computer/laptop.
How long should the map take to load?
In optimal conditions, the map will take less than 10 seconds to load. It may take longer depending on your Internet speed, the size of the dataset and the number of concurrent users.
How much of my Internet data allowance does the map use?
This depends on which dataset(s) you are using and how you use the map, such as whether you combine several datasets. If you are concerned about data usage, you may want to try using the map for a short period and checking with your provider how much data was used. Many telecommunications providers provide websites and apps that you can use to check data usage.
Where does the SEED map come from?
The data layers in SEED are provided by various organisations, including government agencies and Industry. The copyright line on the map will supply more details. The symbology (colours for map layers and data features) are provided by the data custodians.
What technology does the map use?
The map runs on Geocortex, which is web GIS (Geographic Information System) software. Many of the map features and functionality are inherent to Geocortex. Customisation has been kept to a minimum to facilitate upgrades and ongoing maintenance.
Also see SEED Dataset FAQ page for information about the data in SEED.
Providing feedback on the SEED map
Users can provide feedback on the SEED map, datasets, and tools, including general functionality and missing datasets. This can be done directly on the SEED map while having your data layer area of interest loaded.
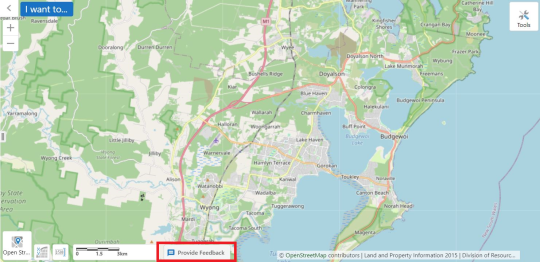
Click the ‘Provide Feedback’ button, located on the bottom of the map.
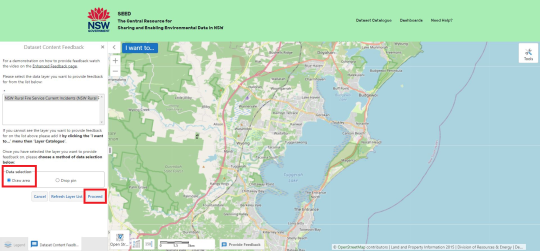
Select ‘General SEED’ for feedback related to general functionality, or ‘Dataset content’ for dataset feedback.
For ‘Dataset content’ feedback, you can select the dataset and define an area of interest using the draw button on the left panel, add mark-ups and text to provide a detailed description of your feedback.
The current map view will be attached to your submission, and you will receive a unique code to follow up on your feedback.
The video below demonstrates how to provide comprehensive feedback, including ways to draw area, insert mark-ups, descriptions and attach supporting files.


